WAIC 2026 Results: Exhibits, Deals, and Procurement
Editorial standards and source policy: Editorial standards, Team. Content links to primary sources; see Methodology.
Last checked: 2026-07-22
The 2026 World Artificial Intelligence Conference closed in Shanghai on July 20. Its post-event figures are more useful than another launch roundup: more than 100,000 square meters of exhibition space, 4,486 exhibits, 351 global launches, 198 first public showcases, 32 signed Shanghai AI projects with planned investment above CNY 40.9 billion, and 212 published procurement requirements with intended procurement of about CNY 20.36 billion.
Those values cannot be combined into a "WAIC deal total." Project investment, procurement intent, and a separate CNY 1.18 trillion envelope of intended credit support involve different parties, conditions, and time horizons. Adding them would turn financing capacity, construction plans, and buyer demand into fictional event revenue.
This closing scorecard is for product, procurement, and engineering teams that need to decide what deserves a follow-up after the event. It does not repeat the launch-by-launch WAIC overview. It asks which numbers are verified, what they do and do not measure, and how to reduce thousands of exhibits to a five-project validation queue.
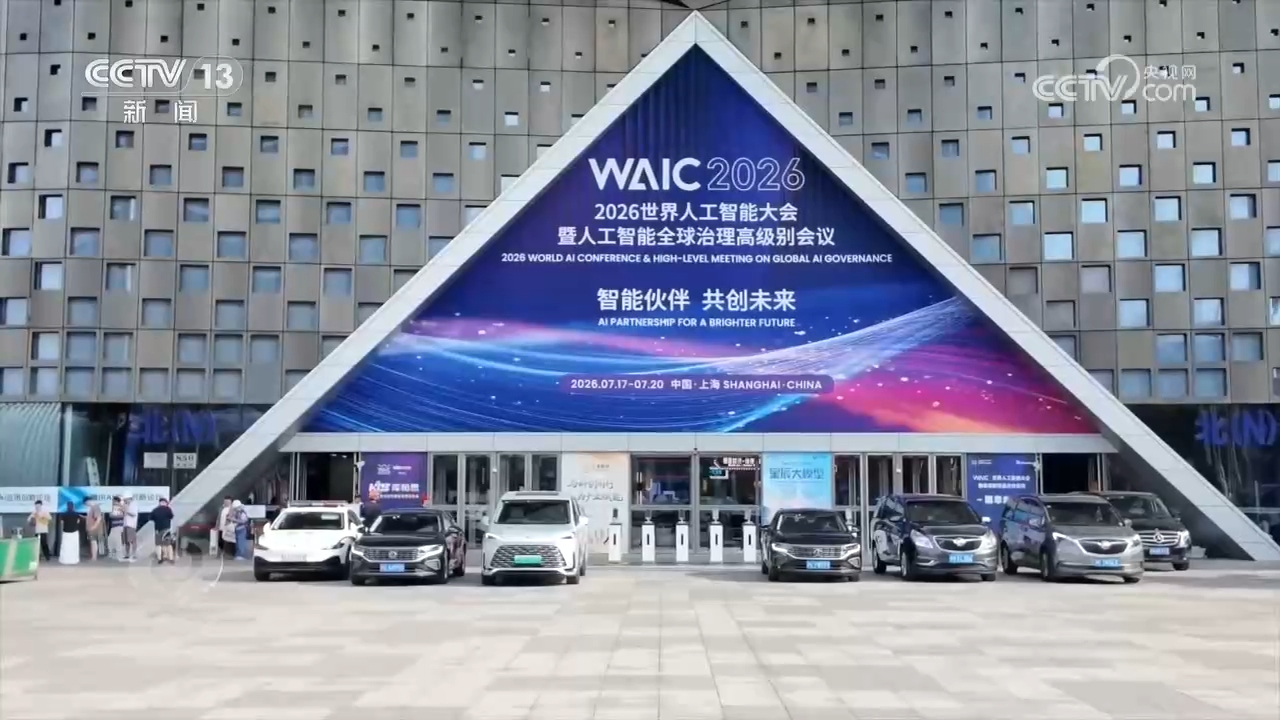
Image source: CCTV closing coverage, July 20, 2026. The image establishes the event and venue; it does not prove procurement conversion or commercial deployment.
Closing scorecard and evidence boundaries
| Metric | Reported result | What it supports | What it does not support |
|---|---|---|---|
| Event dates | July 17-20 | A four-day conference window | The delivery schedule of signed projects |
| Exhibition space | More than 100,000 square meters | Physical event scale | Product maturity or effective selling space |
| Exhibits | 4,486 | Number of displayed items | 4,486 production-ready commercial products |
| Global launches | 351 | Launch density at the event | General availability, delivery, or customer use |
| First showcases | 198 | First public demonstrations | Repeatability outside a controlled booth |
| Offline attendance | More than 400,000 visits | Public and industry attention | Unique buyers or purchase conversion |
| Embodied-intelligence products | 208 | Physical AI was a major event category | Stable operating hours at customer sites |
| Signed projects | 32 projects, investment above CNY 40.9 billion | Planned Shanghai AI project construction | On-site sales, current revenue, or cash received |
| Procurement requirements | 212 requirements from 177 buyer groups | Published demand that suppliers can investigate | Issued purchase orders |
| Intended procurement | About CNY 20.36 billion, up 25% | Direction and scale of buyer intent | Contract value, payment, or recognized revenue |
| Effective matches | 3,874 | Organized supplier-buyer connections | The later conversion rate, which was not disclosed |
The most precise post-event table comes from the Shanghai Securities News closing report dated July 21. CCTV's July 20 report uses rounded language such as more than 1,100 companies and more than 4,000 exhibits. This page uses the later 4,486 figure while retaining the date and source of each claim. China News Service provides another named full-text account of the conference close.
What 4,486 exhibits say about the market
Exhibitor count and exhibition area both increased by more than 30% year over year, while exhibit count increased by nearly 50% according to the closing coverage. Scale alone is not the main change. The show increasingly presented systems rather than isolated model demos.
The reported inventory included 108 chips and more than 200 intelligent-computing products, including large clusters, supernodes, domestic interconnects, and compute-storage integration. A buyer evaluating this layer is not selecting a benchmark number in isolation. The operational questions are scheduler compatibility, networking, energy use, failure isolation, software support, and the cost of running a cluster over time.
Embodied intelligence accounted for 208 products, more than three times the previous year's count in the report. That is strong evidence of category attention. It does not answer how long a robot can work outside the booth, how often a human intervenes, how much retraining a new line requires, or whether the machine can recover after a grasp or navigation failure.
Agents also moved from conference discussion to product packaging. More than 10% of forum themes involved agents, and four of the ten highlighted exhibits were agent products. The relevant commercial unit is no longer a generated paragraph. It is an auditable task: reading context, calling tools, moving through several steps, handling an exception, and leaving evidence a human can review.
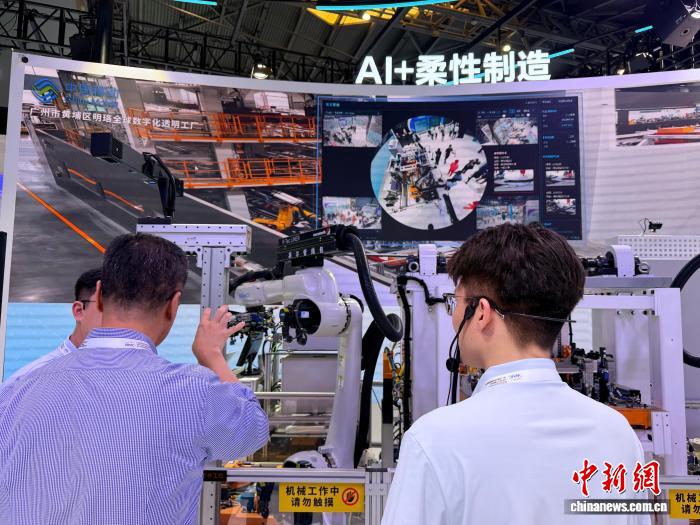
Image source: WAIC 2026 event coverage archived by RadarAI from the named event reporting used in the July 20 conference review. It shows a controlled exhibition setting, not an independently verified factory deployment.
Launch and showcase are not maturity levels
"Global launch" and "first showcase" are communications categories. Procurement teams need operational maturity categories. A useful five-level model is:
| Level | Minimum evidence | Allowed next action | Hold or stop when |
|---|---|---|---|
| L0 lead | Official name, publisher, and dated event evidence | Add to a watch list | The project exists only as a reposted headline |
| L1 reviewable demo | Full demonstration, inputs, outputs, and visible failure context | Schedule technical questions | Only an edited highlight reel is available |
| L2 repeatable trial | Accessible product, documentation, sample data, and stated limits | Run an internal sandbox task | There is no reproducible input or documentation |
| L3 customer-site validation | Defined task, metrics, logs, and intervention record | Start a two- or four-week pilot | The supplier cannot state site conditions or failure handling |
| L4 commercial delivery | Contract scope, SLA, price, acceptance, and maintenance responsibility | Enter procurement review | "Signed" is offered in place of acceptance evidence |
A global launch can remain at L0. An older product can already be at L4. Event novelty and delivery maturity are independent axes.
CNY 40.9 billion is planned project investment
The closing event included 32 Shanghai AI projects with total investment above CNY 40.9 billion. The reported fields span AI infrastructure, agent applications, embodied intelligence, and AI for science. This is a meaningful construction and capital-allocation signal: activity is extending beyond foundation models into compute, applications, and physical systems.
It is not the same as CNY 40.9 billion of contracts signed with conference exhibitors. "Total investment" can include planned spending over several years, land and infrastructure, equipment, financing, and conditions that must be met before construction or operation. A useful follow-up asks for project owner, location, schedule, capital source, procurement stage, and first operational milestone.
CNY 20.36 billion is intended procurement
The conference published 212 requirements from 177 buyer groups, with intended procurement of about CNY 20.36 billion and a reported 25% year-over-year increase. That is closer to a demand thermometer than a revenue result. It shows where buyers want supplier conversations and gives smaller vendors a route into a structured requirement.
The 3,874 effective matches show that meetings occurred. The missing metric is later conversion. A serious review should track how many requirements produce a technical workshop, pilot, issued order, accepted delivery, and payment at 30, 90, and 180 days.
The CNY 1.18 trillion credit-support figure is more distant from product revenue. Credit availability can support qualified firms, but it is neither cash received by AI companies nor purchase volume at WAIC. Keep it in a financing column, not a sales column.
Worked case: a 14-day post-WAIC procurement queue
A manufacturer with three factories sends a five-person team from production, IT, security, procurement, and finance. They collect 120 leads at WAIC. Thirty-five touch visual inspection, maintenance, knowledge assistance, or material handling. The mistake would be booking 35 replay demonstrations.
The team has 14 days to select no more than five validation candidates.
- Days 1-2: normalize evidence. Every lead gets a product owner, source URL, exact task, maturity level, deployment form, named customer evidence, and unresolved claim. Leads without a named product or dated source stop here.
- Days 3-5: send a common task packet. For visual inspection, supply 500 historical images including 80 known defects and require per-image results with latency and false-positive counts. For material handling, define container weight, route, cycle count, safety zone, and recovery behavior.
- Days 6-9: run technical calls around failures. Ask what happens on network loss, identity failure, changed lighting, blocked routes, malformed tool output, or model timeout. A polished success path without a failure path does not advance.
- Days 10-12: score total work. Include integration labor, data preparation, hardware, human intervention, logging, security review, rollback, and supplier support. Do not rank on model accuracy alone.
- Days 13-14: select up to five pilots. Each pilot needs a business owner, technical owner, fixed input set, acceptance threshold, stop signal, and two- or four-week limit.
| Gate | Pass condition | Stop signal |
|---|---|---|
| Evidence | Named product, dated source, full task path | Only a booth photo or edited demo |
| Reproducibility | Supplier accepts the common input packet | Supplier insists on a hidden private demo |
| Integration | Interfaces, permissions, logs, and data retention are documented | Core identity or data path cannot be explained |
| Economics | Pilot budget and human workload are bounded | "Free pilot" with open-ended internal labor |
| Safety | Failure state, manual takeover, rollback, and incident owner are explicit | No safe stop or accountable operator |
The queue succeeds if the team can reject most leads quickly and produce five comparable pilot briefs. More meetings are not the acceptance metric.
What to track over the next 90 days
Track four conversions separately: project investment moving to construction, procurement intent moving to issued orders, pilots moving to accepted deployment, and displayed robots or agents accumulating stable customer operating hours. These measures will reveal whether WAIC's scale became delivery capacity.
Do not conclude that 4,486 exhibits were 4,486 commercial products, that 351 launches became available immediately, that CNY 40.9 billion was event revenue, or that CNY 20.36 billion has already been purchased. The strongest current conclusion is narrower: WAIC 2026 expanded the supply surface and organized unusually large project and demand pipelines, but the conversion evidence comes after the conference.
FAQ
How many exhibits were at WAIC 2026?
The post-event Shanghai Securities News report gives 4,486. Earlier closing coverage used rounded language of more than 4,000.
Did WAIC generate CNY 40.9 billion in sales?
No. That figure is total investment for 32 signed Shanghai AI projects, not on-site product revenue.
Was CNY 20.36 billion already purchased?
No. It is intended procurement associated with published requirements. Orders, acceptance, payment, and revenue are later stages.
What is the most useful result for a procurement team?
The structured requirements and supplier connections are useful if converted into a small, comparable pilot queue with fixed inputs, acceptance rules, and stop signals.
Are the 208 embodied-intelligence products proven in factories?
The count shows exhibition activity. Customer-site stability requires separate evidence such as cycle success, intervention rate, operating hours, maintenance, and accepted delivery.
Sources
- WAIC official site
- CCTV closing report, July 20, 2026
- Shanghai Securities News closing scorecard, July 21, 2026
- China News Service closing coverage
Related reading
- Qwen API pricing and access for builders: verify the model, region, and real test cost
- MiniMax long-context API evaluation: test evidence retrieval before trusting the window size
- GLM coding API evaluation for builders: test one repository patch with diff, tests, and rollback
- Cloudflare Pay Per Crawl test guide: what publishers and AI crawlers can verify in private beta
RadarAI helps builders track AI updates, compare source-backed signals, and decide which changes are worth acting on.